2023-09-07 00:00:00
6 min read
In the realm of data-driven enterprise decision-making, Power BI has emerged as an indispensable ally, enabling organizations to distill complex data into actionable insights. At the core of Power BI's analytical prowess lies Data Analysis Expressions, more commonly known as DAX. This sophisticated language empowers professionals to not only navigate through vast datasets but also to perform intricate calculations and transformations with precision.
In this comprehensive blog, we embark on a journey through the world of DAX functions within Power BI. Our primary aim is to equip you with a profound understanding of these essential functions by providing clear syntax explanations and practical examples.
DAX Syntax and Structure
Understanding the syntax and structure of Data Analysis Expressions (DAX) is fundamental to harnessing its power within Power BI. DAX formulas have a well-defined structure that combines functions, operators, and values to perform data manipulations.
At its core, a DAX formula consists of a function, followed by a set of arguments enclosed in parentheses. These arguments can include column or table references, constants, or expressions. Operators, such as arithmetic symbols (+, -, *, /), are used to manipulate values within a formula, and they follow standard mathematical rules. The organization of DAX is logical and consistent, making it accessible even to those new to the language.
To illustrate, let's consider a simple DAX formula. Suppose you have a table of sales data, and you want to calculate the total sales for a specific product category. In DAX, you would use the SUMX function to achieve this. The formula might look like this:
Total Sales = SUMX(Sales, Sales[Amount])
In this example:
'Total Sales' is the name of the calculated measure we're creating.
'SUMX' is the DAX function used to sum the values.
'Sales' is the table containing the data.
'Sales[Amount]' is the column from which we want to sum the values.
This straightforward formula exemplifies the core components of DAX syntax: function name, arguments enclosed in parentheses, and the use of table and column references.
Common Power BI Dax Functions
In the realm of Power BI, common DAX functions serve as the building blocks for extracting valuable insights from your data. These functions are essential tools for performing various calculations and transformations. Let's delve into a selection of these indispensable DAX functions, starting with the following:
1. SUM
Syntax: SUM(<column>)
Explanation: The SUM function, as its name suggests, calculates the sum of the values in a specified column. It is especially useful for aggregating numerical data, such as sales figures or quantities.
Example: Suppose you have a 'Sales' table with a column named 'Revenue'. To find the total revenue, you would use the SUM function like this:
Total Revenue = SUM(Sales[Revenue])
2. AVERAGE
Syntax: AVERAGE(<column>)
Explanation: AVERAGE computes the average value of the numbers in a given column. This function is valuable for determining the average sales price, rating, or any other numeric metric.
Example: If you want to calculate the average rating in a 'Product Reviews' table with a 'Rating' column, you can employ the AVERAGE function:
Average Rating = AVERAGE('Product Reviews'[Rating])
3. COUNT
Syntax: COUNT(<column>)
Explanation: COUNT, as the name implies, counts the number of rows in a specified column that contain data. It is often used to determine the total number of entries or occurrences in a dataset.
Example: To count the number of products in a 'Products' table, you would use the COUNT function like this:
Total Products = COUNT(Products[ProductID])
4. MAX and MIN
Syntax: MAX(<column>) and MIN(<column>)
Explanation: MAX and MIN functions identify the maximum and minimum values, respectively, within a specified column. They are valuable for finding the highest and lowest data points in your dataset.
Example: To determine the highest and lowest sales values in a 'Sales' table's 'Amount' column, you can utilize MAX and MIN as follows:
Highest Sales = MAX(Sales[Amount])
Lowest Sales = MIN(Sales[Amount])
5. FILTER
Syntax: FILTER(<table>, <filter_expression>)
Explanation: FILTER allows you to create a new table that includes only the rows that meet specific criteria. It is instrumental for slicing and dicing data based on defined conditions.
Example: Suppose you have a 'Customer' table and want to filter it to include only customers from a specific region (e.g., 'West'). You can use FILTER like this:
West Region Customers = FILTER(Customer, Customer[Region] = "West")
6. CALCULATE
Syntax: CALCULATE(<expression>, <filter1>, <filter2>, ...)
Explanation: CALCULATE is a versatile function that modifies the context in which calculations occur. It enables you to apply filters or conditions to specific calculations.
Example: If you want to calculate the total revenue for a particular product category (e.g., 'Electronics'), factoring in only the sales from the year 2023, you can use CALCULATE like this:
Total Revenue 2023 Electronics = CALCULATE(SUM(Sales[Revenue]), Sales[Year] = 2023, Products[Category] = "Electronics")
7. ALL
Syntax: ALL(<table>)
Explanation: The ALL function removes filters from a table, allowing you to analyze data without the constraints of existing filters. It is helpful for examining data in a broader context.
Example: To calculate the total sales for all products regardless of any current filters, you can use the ALL function in combination with SUM:
Total Sales (All Products) = CALCULATE(SUM(Sales[Amount]), ALL('Products'))
8. RELATED
Syntax: RELATED(<related_table>[, <related_column>])
Explanation: The RELATED function is used to fetch data from related tables. It helps you retrieve values from a related table based on the current row's context in the primary table.
Example: Suppose you have a "Sales" table and a related "Products" table, and you want to fetch the product name associated with each sale. You can use the RELATED function like this:
Product Name = RELATED(Products[ProductName])
9. COUNTROWS
Syntax: COUNTROWS(<table>)
Explanation: COUNTROWS counts the number of rows in a table, which can be useful for various calculations, including determining the number of items in a filtered table or the number of orders for a specific customer.
Example: If you want to find the number of orders for each customer in a "Sales" table, you can use COUNTROWS like this:
Orders per Customer = COUNTROWS(FILTER(Sales, Sales[CustomerID] = EARLIER(Sales[CustomerID])))
What are Time Intelligent DAX Functions in Power BI?
Time is a critical dimension in the world of data analysis, and when working with time-based data, the significance of time intelligence functions becomes evident. These specialized functions are specifically designed to facilitate date-based calculations, making them essential tools for any analyst or organization dealing with time-series data. Time intelligence functions empower users to compare, analyze, and visualize data over different time periods, enabling trend analysis, year-over-year comparisons, and much more.
Let's delve into a few essential time intelligence functions and explore how they can be applied to gain deeper insights from your data:
1. DATESYTD
Syntax: DATESYTD(<dates>, [<year_end_date>], [<filter>])
Explanation: DATESYTD is used to calculate the year-to-date total for a given set of dates. It's particularly handy for tracking cumulative performance over time, such as YTD sales or revenue.
Example: Suppose you want to find the year-to-date sales for each date in a 'Sales' table, where your fiscal year ends on March 31st. You can use DATESYTD like this:
YTD Sales = DATESYTD(Sales[Date], "03/31")
2. TOTALYTD
Syntax: TOTALYTD(<expression>, <dates>, [<year_end_date>], [<filter>])
Explanation: TOTALYTD extends the DATESYTD function by allowing you to calculate the year-to-date total for a measure or expression. It's instrumental in situations where you want to evaluate a dynamic measure over time.
Example: Let's say you have a measure called "Total Revenue" and want to find the year-to-date total revenue, considering the same fiscal year end date of March 31st:
YTD Total Revenue = TOTALYTD([Total Revenue], Sales[Date], "03/31")
3. SAMEPERIODLASTYEAR
Syntax: SAMEPERIODLASTYEAR(<dates>)
Explanation: SAMEPERIODLASTYEAR helps you compare data with the corresponding period from the previous year. This function is crucial for identifying trends, seasonality, or growth year-over-year.
Example: To calculate the sales for the same period in the previous year for each date in a "Sales" table, you can utilize SAMEPERIODLASTYEAR as follows:
Sales Last Year = CALCULATE(SUM(Sales[Amount]), SAMEPERIODLASTYEAR(Sales[Date]))
Whether you're tracking business performance over time, identifying seasonality, or comparing data to past periods, these functions are indispensable tools in your analytical arsenal.
What are Advanced DAX Functions in Power BI?
While common DAX functions form the foundation of your analytical toolkit, advanced DAX functions take your data analysis capabilities in Power BI to the next level. These functions offer greater flexibility and sophistication, allowing you to tackle complex scenarios and make more informed decisions.
In this section, we'll explore a few advanced DAX functions—SUMX, RANKX, and SWITCH—and delve into their syntax, use cases, and practical examples.
1. SUMX
Syntax: SUMX(<table>, <expression>)
Explanation: SUMX is a versatile function that calculates the sum of a specified expression for each row in a table. It's particularly useful when you need to perform calculations on a row-by-row basis.
Use Case: Imagine you have a ‘Sales’ table and want to calculate the total revenue for each product by multiplying the unit price and quantity. You can achieve this with SUMX:
Total Revenue = SUMX(Sales, Sales[UnitPrice] * Sales[Quantity])
2. RANKX
Syntax: RANKX(<table>, <expression>[, <value>[, <order>[, <ties>]]])
Explanation: RANKX assigns a rank to each row in a table based on a specified expression. It's handy when you need to determine the ranking of items within a dataset.
Use Case: Suppose you have a ‘Sales’ table and want to rank products based on their sales revenue. You can use RANKX like this:
Product Rank = RANKX(Sales, [Total Revenue], , DESC)
3. SWITCH
Syntax: SWITCH(<expression>, <value1>, <result1>[, <value2>, <result2>, ...[, <else>]])
Explanation: SWITCH is a conditional function that allows you to specify multiple conditions and their corresponding results. It's useful for creating dynamic calculations based on different scenarios.
Use Case: Let's say you want to categorize products based on their sales into ‘Low,’ ‘Medium,’ and ‘High.’ You can achieve this with SWITCH:
Sales Category =
SWITCH(
TRUE(),
[Total Revenue] < 1000, "Low",
[Total Revenue] < 5000, "Medium",
[Total Revenue] >= 5000, "High"
)
In conclusion, mastering Data Analysis Expressions (DAX) functions within Power BI is essential for unleashing the full potential of your data analysis efforts.
Whether you're crafting measures for dynamic dashboards or optimizing calculated columns for enriched datasets, DAX empowers you to transform data into actionable intelligence, making informed decisions that drive success in the ever-evolving world of enterprise analytics.
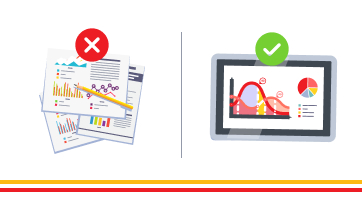
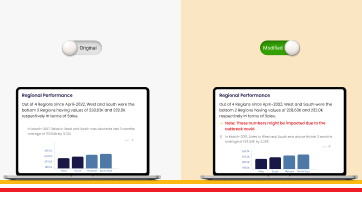
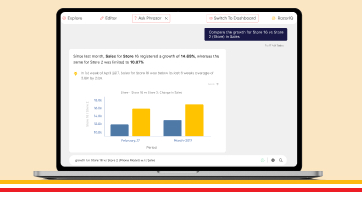
Phrazor helps you summarize Power BI and Tableau dashboards in language using AI.
Leverage Phrazor to generate crisp insights with reasoning, drive adoption of your dashboards and to get language-based insights for non-technical stakeholders.
Start your 14 day free trial of Phrazor for Power BI today
About Phrazor
Phrazor empowers business users to effortlessly access their data and derive insights in language via no-code querying